Are Your PDFs Actually Getting Read?
Most marketers can quote their opt in rate and monthly leads in their sleep. Far fewer can answer the real question:
Out of everyone who downloaded this thing, how many actually finished it and heard our full pitch?
That is what the Audio vs PDF funnel calculator is built to explore. Not just downloads. Actual consumption, and the impact on revenue when you offer a simple “read or listen” option.
In this post, we will walk through:
- Why downloads are a flattering but misleading metric
- The simple assumptions behind the calculator
- A realistic example with numbers that feel like a normal business
- Why pairing PDF with short audio often beats either on its own
- How to use the calculator to decide where to test audio first
Use this as the companion guide to the calculator below and, if you prefer listening, as the script for the audio ebook version.
Audio vs PDF funnel calculator
Add a few real numbers from your funnel to see how your PDF compares with an audio version and a simple “read or listen” bundle.
1. Add your funnel numbers
Defaults assume roughly 10% of PDF leads fully consume the asset, ~35% for short audio, and ~45% when you offer PDF + audio together. Fully-consumed leads are treated as about 2× more likely to buy.
2. Estimated monthly impact
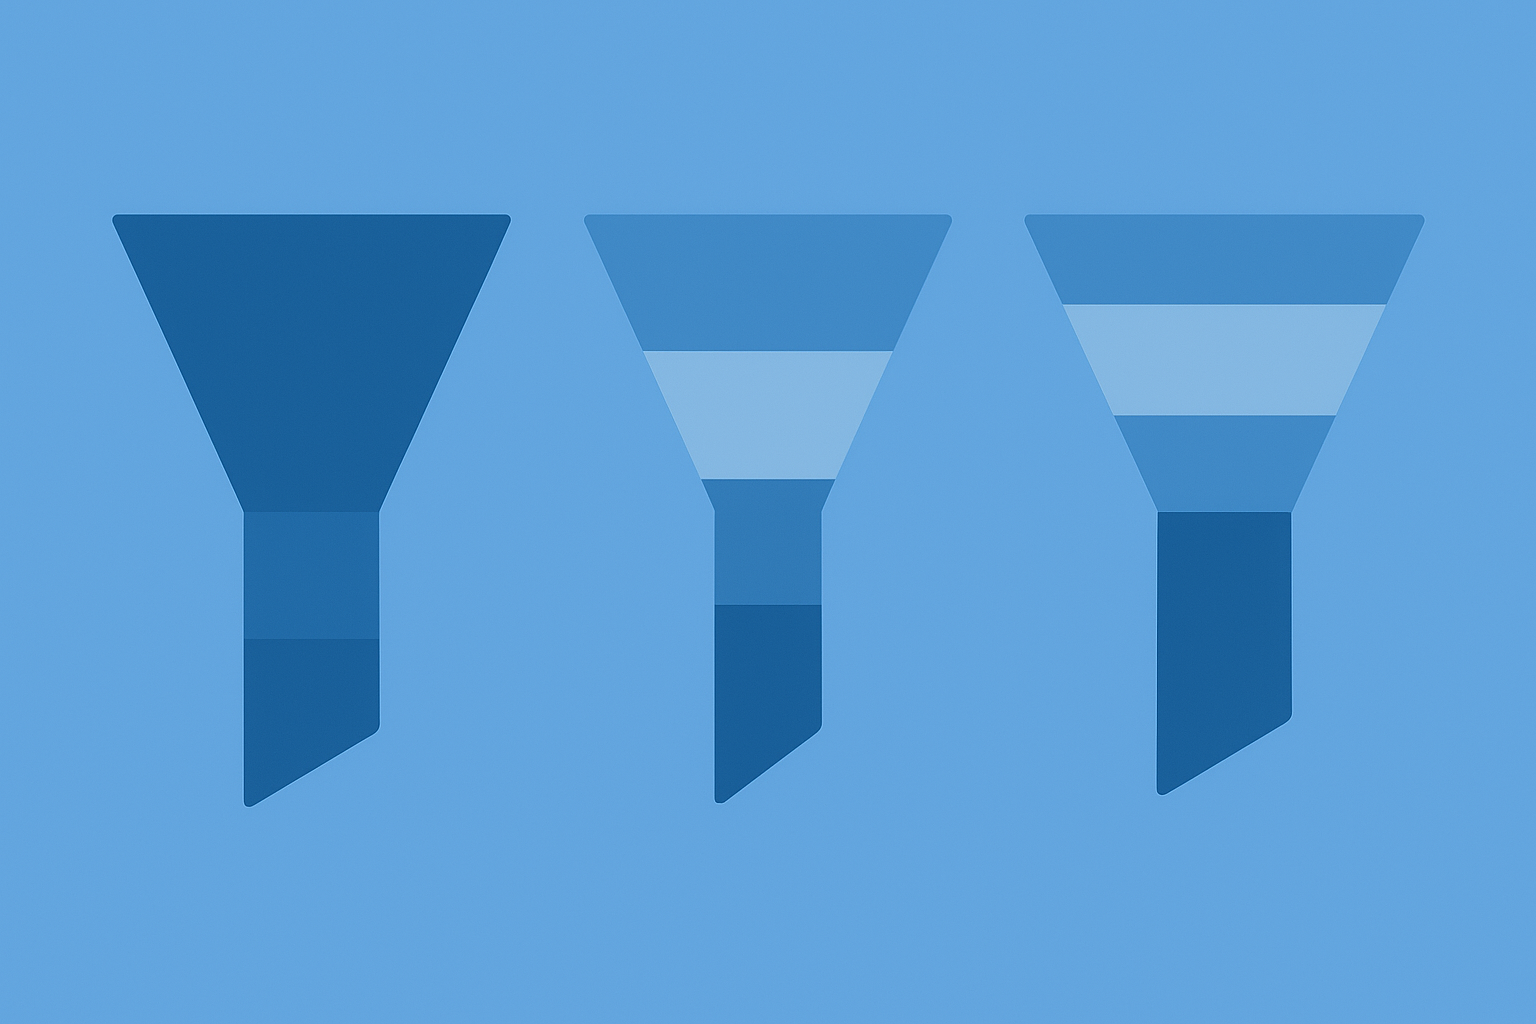
3. How the funnels change
These mini-funnels scale by the share of visitors who make it to each stage. Bars narrow as people drop out, so you can see where audio and PDF + audio pull ahead.
PDF funnel (current)
Audio funnel (audio only)
Companion funnel (PDF + audio)
These numbers are directional only. Defaults use mid-range benchmarks for how often PDFs vs audio are actually consumed, and treat fully-consumed leads as roughly twice as likely to buy as skimmers. Use this to sanity-check whether trying audio on one of your existing assets could be worthwhile, not as a forecast.
1. The problem with “we got 500 downloads”
Let us start with a grounded funnel. No fantasy numbers.
Imagine a company with one solid flagship guide on a focused topic:
- 10,000 visitors to the landing page per month
- 1.5 percent opt in rate for the PDF
- 3 percent of leads become customers over time
- £3,000 average revenue per new customer
On paper, the funnel looks like this:
- 10,000 visitors
- 150 new leads
- Around 4 to 5 new customers
- Roughly £12,000 to £15,000 in monthly revenue from this one asset
That already sounds healthy.
The problem is what happens between “download” and “customer”. Most people:
- Save the PDF into a folder called “Stuff to read”
- Skim page 1 on their laptop while distracted
- Tell themselves they will come back to it
- Never do
Your opt in rate looks good, but only a slice of those people ever experience the full argument you worked so hard on. If your best proof, stories and offer are in the second half of the guide, a lot of your “leads” never really see them.
2. Completion is where the real leverage lives
For long form content, the question is not “do people care about this topic”. It is “how easy do we make it to actually finish”.
Someone who downloads a PDF and never opens it:
- Behaves more like a cold lead
- Does not fully understand your approach
- Does not get that “these are my people” moment
Someone who gets to the end:
- Has spent 15 to 30 minutes in your world
- Has seen your strongest proof and examples
- Is far more likely to trust you and take the next step
In the calculator, we make a simple distinction:
- A fraction of leads fully consume the asset
- The rest skim or bail out early
- Fully consumed leads are treated as roughly twice as likely to buy as skimmers
You can change these assumptions if you have your own data, but they are a realistic starting point for most teams.
3. What the calculator assumes in plain English

To keep things honest and simple, the default calculator settings do something like this:
- For a PDF only funnel
- Around 10 percent of leads will realistically read the whole thing
- For a short audio version of the same content
- Around 35 percent of leads will make it to the end
- For a PDF plus audio bundle where people can read or listen
- Around 45 percent fully consume at least one format
On top of that:
- Fully consumed leads are worth about 2 times a skimmer in terms of conversion
- When you add audio as an option, you might also see a small bump in opt in rate, because “I can listen on the train” feels easier than “I will sit and read this later”
These are not exact predictions. They are reasonable defaults inspired by how people like to consume content in the real world.
4. A realistic example: from PDF to audio, then PDF plus audio

Let us plug our earlier funnel into those assumptions.
4.1 Baseline PDF funnel
- Visitors: 10,000
- Opt in rate: 1.5 percent
- Leads: 150
- Only 10 percent are likely to fully read the PDF
- About 15 finishers
- About 135 skimmers
Now give those two groups different buying behaviour:
- Skimmers convert at about 2 percent
- Finishers convert at about 4 percent
That gives you roughly:
- Skimmers: 135 × 2 percent ≈ 2.7 customers
- Finishers: 15 × 4 percent ≈ 0.6 customers
So you end up with around 3 to 4 customers per month from this asset. At £3,000 per customer, that is around £9,000 to £12,000 in monthly revenue.
4.2 What happens if you switch to audio only?
Keep everything else the same, but replace the PDF with a short audio version of the same content.
- Visitors: 10,000
- Opt in rate: still 1.5 percent
- Leads: still 150
- Completion: around 35 percent make it to the end
- About 52 finishers
- About 98 skimmers
Using the same conversion logic:
- Skimmers: 98 × 2 percent ≈ 2 customers
- Finishers: 52 × 4 percent ≈ 2 customers
You end up with roughly 4 customers per month instead of 3. At £3,000 each, that is about £12,000 per month.
Same traffic, same opt in rate, same topic. No clever new offer. Just a format that more people actually finish.
4.3 What happens if you offer PDF plus audio together?
Now take the same asset and offer it as a simple “read or listen” bundle:
- Visitors: 10,000
- Opt in rate improves slightly because it feels more flexible
- Up from 1.5 percent to 1.8 percent
- Leads: 180
- Completion: around 45 percent fully consume in either format
- About 81 finishers
- About 99 skimmers
Apply the same conversion idea:
- Skimmers: 99 × 2 percent ≈ 2 customers
- Finishers: 81 × 4 percent ≈ 3 customers
Now you are at around 5 customers per month from this same page. At £3,000 per customer, that is roughly £15,000 per month.
Compared to the original PDF only version:
- PDF only: around 3 customers, about £9k per month
- Audio only: around 4 customers, about £12k per month
- PDF plus audio: around 5 customers, about £15k per month
No new traffic, no extra ad spend, no whole new funnel. You simply changed how easy it is for people to get to the end.
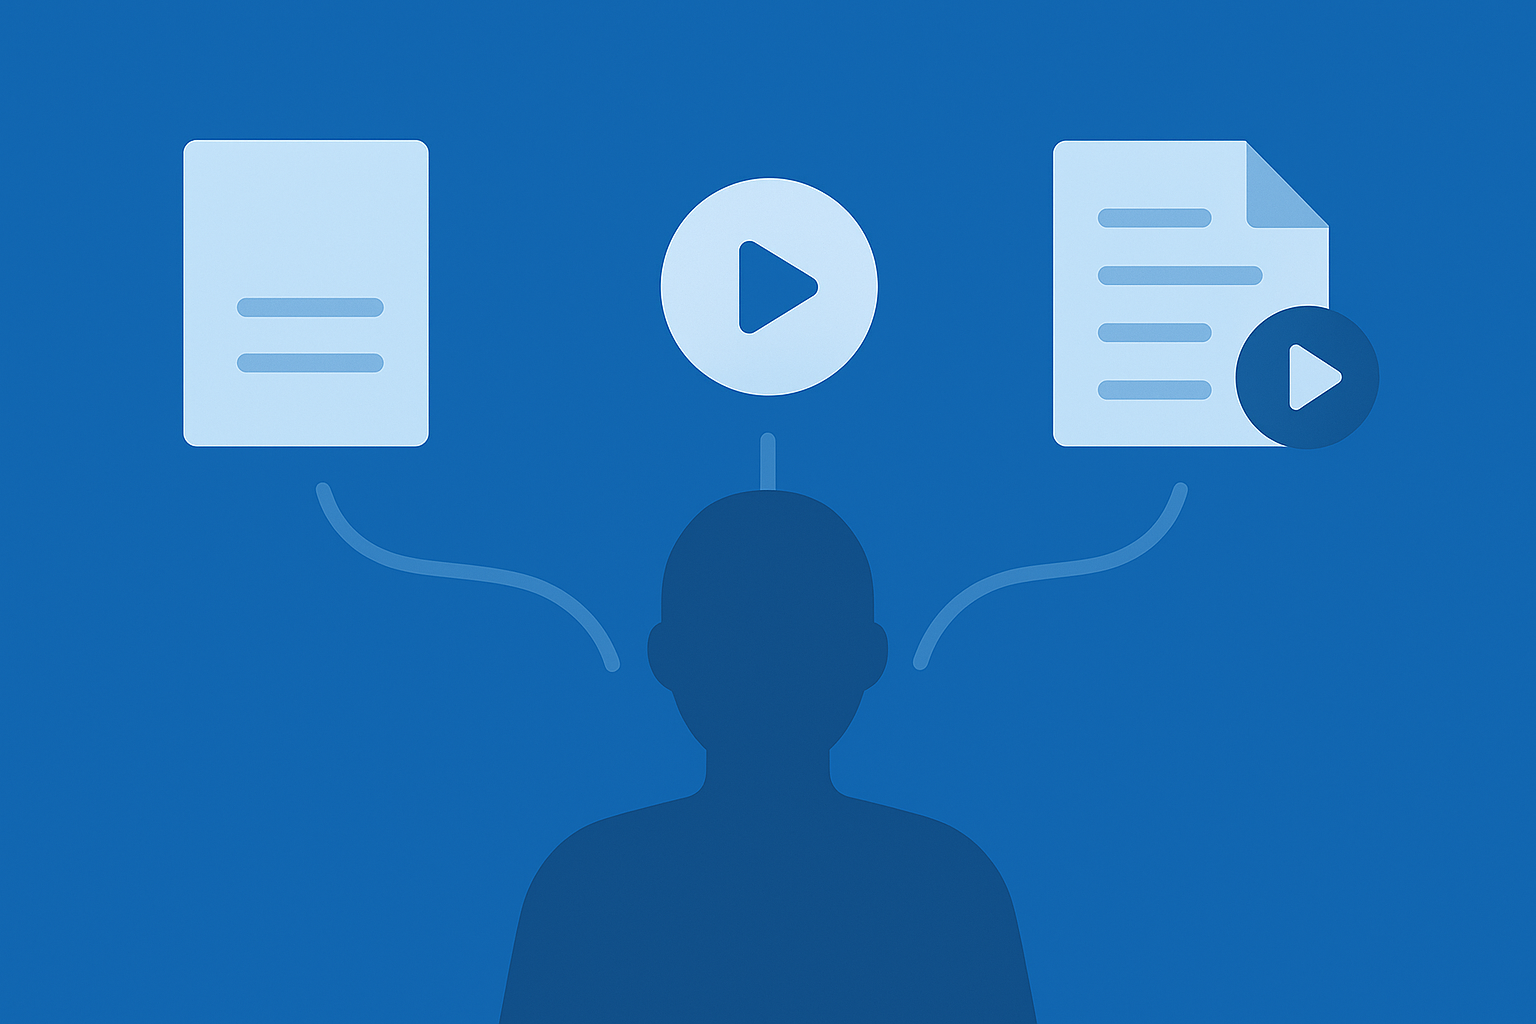
5. Why “read or listen” beats picking a side
Marketers often frame this as “PDF versus audio”. In reality, the most powerful option is usually PDF and audio together.
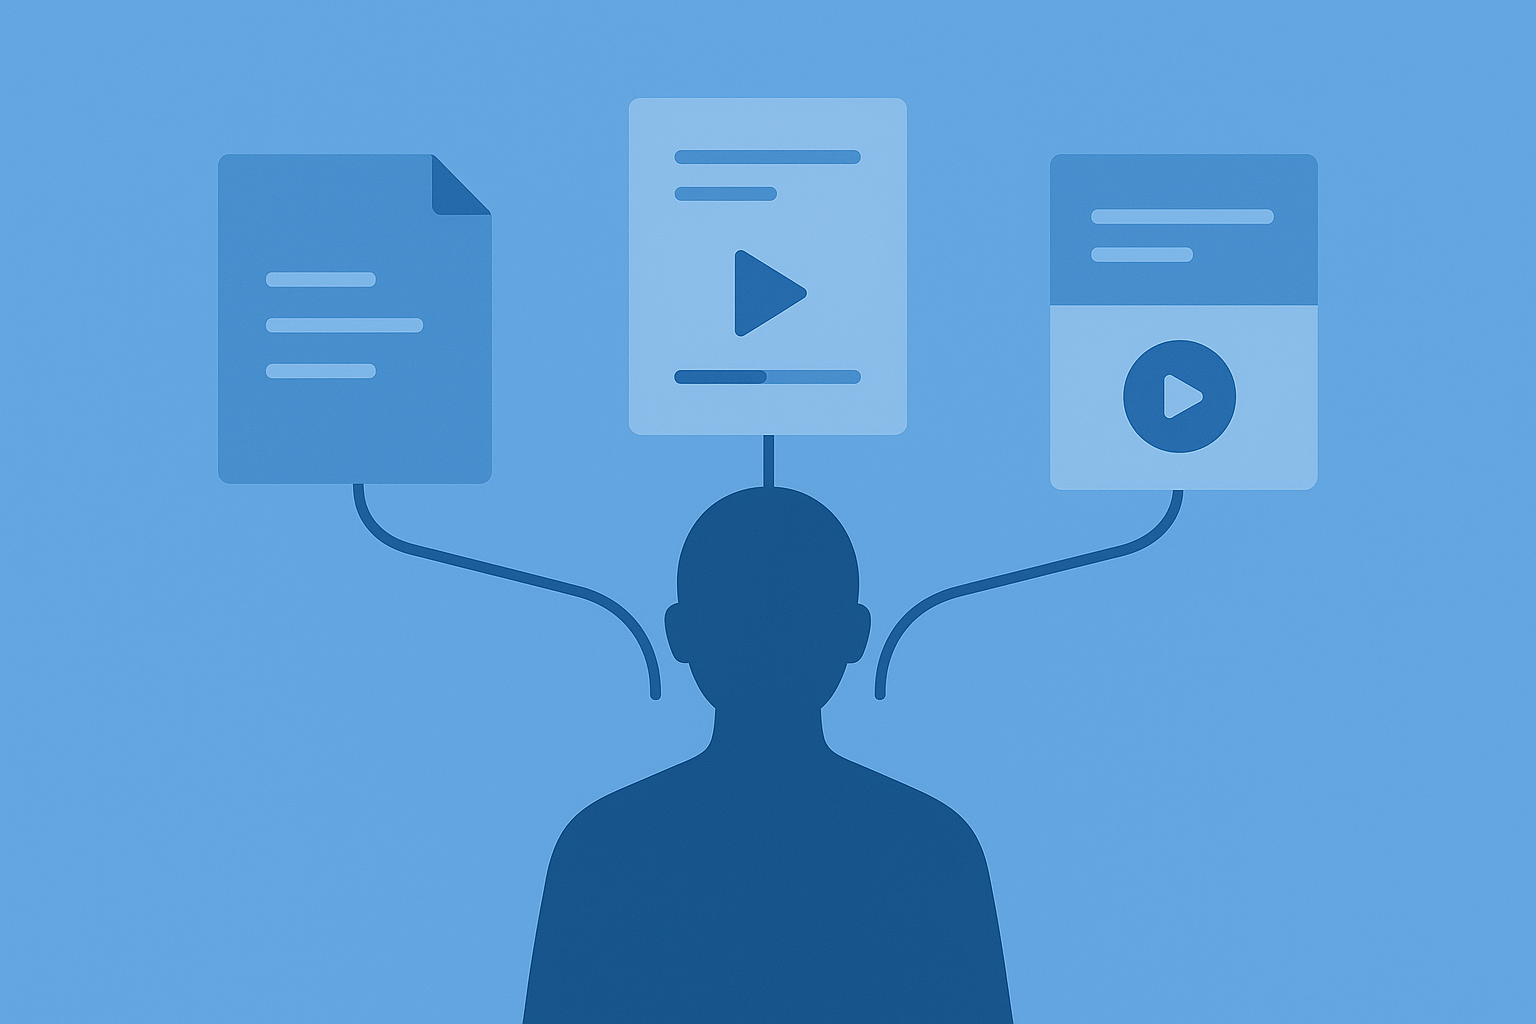
5.1 You match how different people actually consume content
Some people genuinely prefer to read. Others like to listen while commuting, cooking or dealing with email.
When you offer both formats:
- Readers still get their PDF
- Busy people can queue the audio on their phone
- People who start in one format can finish in the other
You are not forcing a choice. You are respecting people’s lives.
5.2 The perceived value jumps
“Free PDF” sounds like yet another thing to ignore.
“Short guide plus a narrated audio version you can listen to on your commute” feels more like:
- A mini course
- A concise workshop
- Something with real effort behind it
That extra perceived value makes the opt in feel more worthwhile, even before they consume anything.
5.3 You get more chances to be remembered
Someone might:
- Skim the PDF on their laptop
- Later spot the “listen instead” link in their inbox
- Finish the content on a walk or in the car
Every one of those moments is another chance to be remembered, build trust and nudge them closer to booking a call or starting a trial.
6. How to use the calculator for your own funnel
Here is a simple way to use it.
Step 1: Start with an asset that already works a bit
Pick one guide, report or ebook that:
- Already has some traffic
- Already gets opt ins
- Already generates customers, even if slowly
You are looking for “quietly successful”, not “total failure”.
Step 2: Plug in your real funnel numbers
In the calculator:
- Enter your monthly visitors to the landing page
- Add your current opt in rate
- Enter your lead to customer rate for that asset
- Add your average revenue per new customer
You can be rough rather than precise, but try to base it on real data.
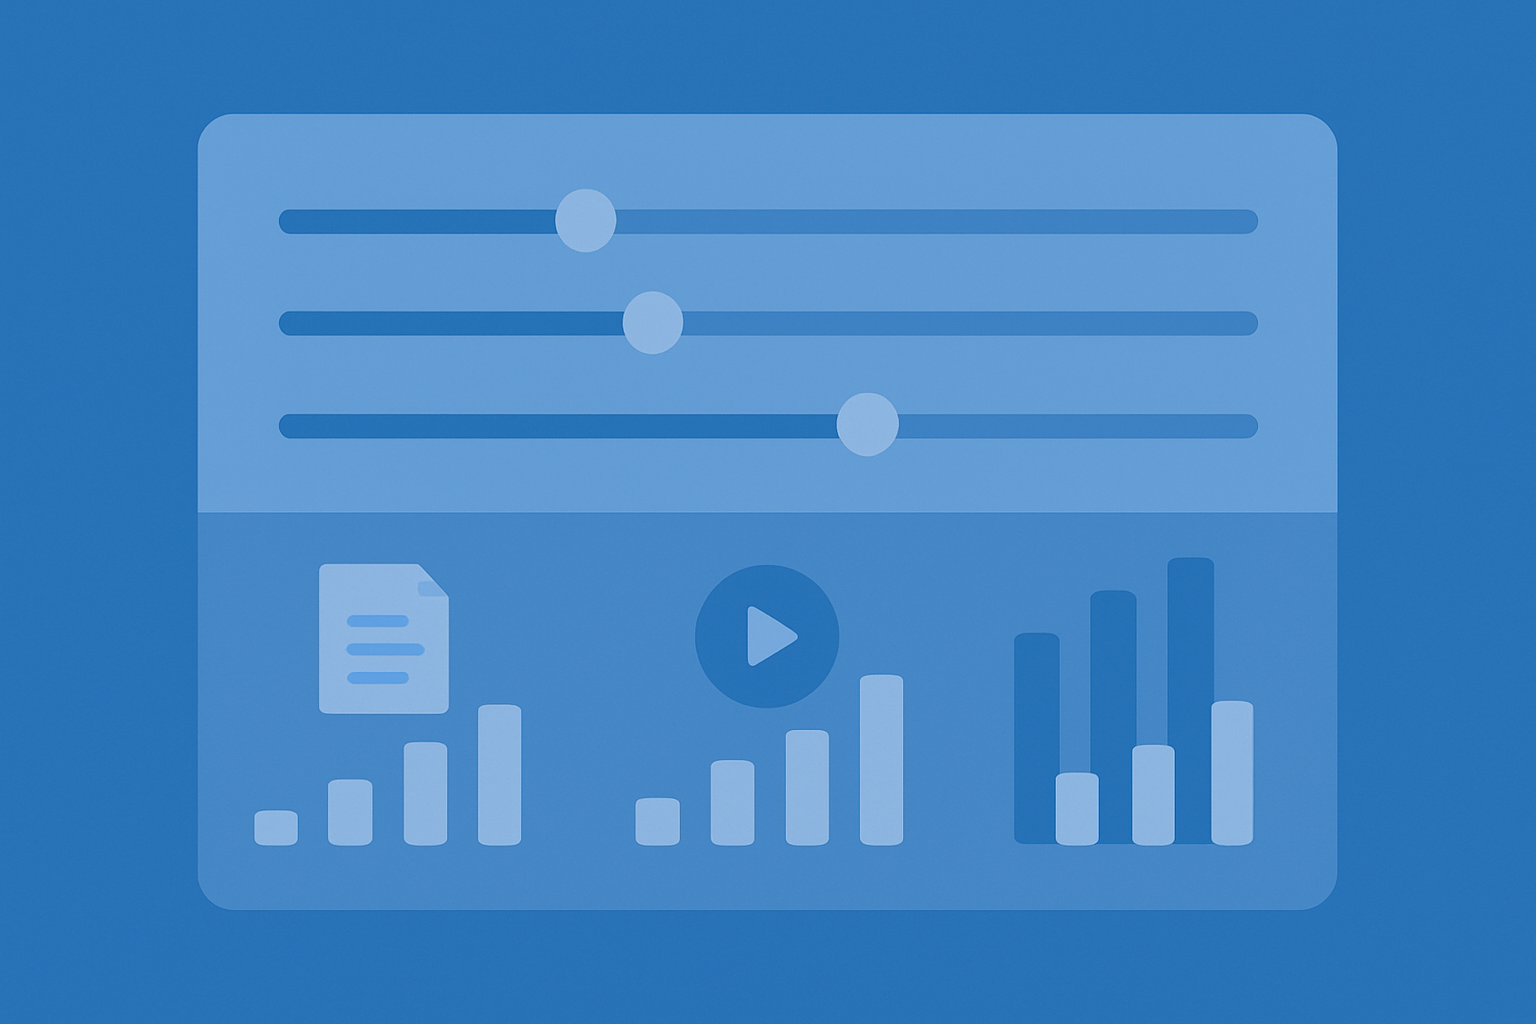
Step 3: Compare the three outputs
Look at:
- The projected revenue from PDF only
- The projected revenue from audio only
- The projected revenue from PDF plus audio
Then look at the mini funnels:
- How much bigger the “fully consumed” layer is for audio and for the bundle
- How many extra customers that translates into each month
You are asking a simple question:
Is this potential uplift worth one short audio recording and a bit of setup?
7. Where to start if you decide to test audio
If the calculator suggests there is meaningful upside, here is a simple plan.
- Pick one asset
Choose the guide with the best mix of traffic and relevance to your main offer. - Turn it into a tight 10 to 20 minute audio
Cut fluff, keep the key stories, examples and arguments. Read it in a natural, conversational tone or use a high quality voice. - Offer both formats on the same page
Keep your existing PDF and add audio as “listen instead” or “read or listen”. - Measure a few basics over the next 30 to 60 days. Opt in rate to the asset, lead to customer rate, and any change in sales cycle length or deal size.
- Feed the new numbers back into the calculator
See how your real data compares with the default assumptions and adjust them if needed.
Once you have one clear win, it becomes easier to justify turning your other best assets into “read or listen” experiences too.
8. The quiet advantage of audio

The key insight is not that audio is trendy or clever. It is that making it easier for people to finish the story you are already telling is one of the simplest ways to:
- Lift conversions without more traffic
- Increase the value of leads you are already getting
- Deepen trust before a person ever hops on a call or starts a trial
Your Audio vs PDF funnel calculator is a way to make that visible. It helps you move from “downloads” as a vanity metric to “completion” as a serious growth lever.
Next step: take one real asset, plug your numbers into the calculator below and see what happens when you imagine it as a “read or listen” bundle instead of a lonely PDF.
Audio vs PDF funnel calculator
Add a few real numbers from your funnel to see how your PDF compares with an audio version and a simple “read or listen” bundle.
1. Add your funnel numbers
Defaults assume roughly 10% of PDF leads fully consume the asset, ~35% for short audio, and ~45% when you offer PDF + audio together. Fully-consumed leads are treated as about 2× more likely to buy.
2. Estimated monthly impact
3. How the funnels change
These mini-funnels scale by the share of visitors who make it to each stage. Bars narrow as people drop out, so you can see where audio and PDF + audio pull ahead.
PDF funnel (current)
Audio funnel (audio only)
Companion funnel (PDF + audio)
These numbers are directional only. Defaults use mid-range benchmarks for how often PDFs vs audio are actually consumed, and treat fully-consumed leads as roughly twice as likely to buy as skimmers. Use this to sanity-check whether trying audio on one of your existing assets could be worthwhile, not as a forecast.